How an industrial electronics manufacturer built a device monitoring system with Connhex
The customer has asked us to keep certain details confidential, while agreeing to share an overview of how Connhex is used. We hope to be able one day to describe this use case in full. In the meantime, this page contains an overview.
The company is a European leader in the design and manufacture of electronic devices for industrial automation.
Their catalog includes controllers, PLCs, Linux HMI operator panels, I/O modules, sensors and converters. Their products are deployed across a wide range of industries - from process control to heat treatment, from energy management to industrial refrigeration - with an international distribution network and tens of thousands of active installations worldwide.
The Challenge
When their devices are installed at industrial sites, the manufacturer effectively loses visibility into how those devices behave over time. Devices operate under very different conditions: varying ambient temperatures, different workloads depending on the application and more or less intensive usage cycles.
The question the company was asking was straightforward: how are our products actually performing in the field? The data available was limited to support tickets which, by definition, only arrive after something has already gone wrong. There was no complete picture of the real-world performance of devices in active use.
The goal was twofold. First, to build a performance monitoring system for their products — tracking CPU consumption, RAM usage, disk occupancy, and operating temperatures — to identify potential issues before they escalate into failures. Second, to collect real field data to feed a continuous product improvement cycle: understanding where to intervene in future hardware and firmware revisions based on concrete evidence, not assumptions.
The Solution: Connhex and the System Monitor addon
The choice fell on Connhex because it addressed this need precisely: a complete infrastructure for data collection, transmission, and visualization, already validated and tested, ready to be integrated on the company's embedded Linux devices.
The key component of the solution is the System Monitor addon for Connhex Edge. System Monitor runs directly on the device and automatically collects system metrics such as CPU usage, RAM usage, and disk space. Data is transmitted to Connhex Cloud with no manual configuration required from the end user.
The main advantage of this approach? Nothing had to be built from scratch. System Monitor is a fully configurable Connhex Edge addon: you select which metrics to collect, set the sampling interval and it starts gathering data. Connhex's cloud infrastructure handles everything else: storage, indexing, visualization and alerts.
Continuous Performance Monitoring
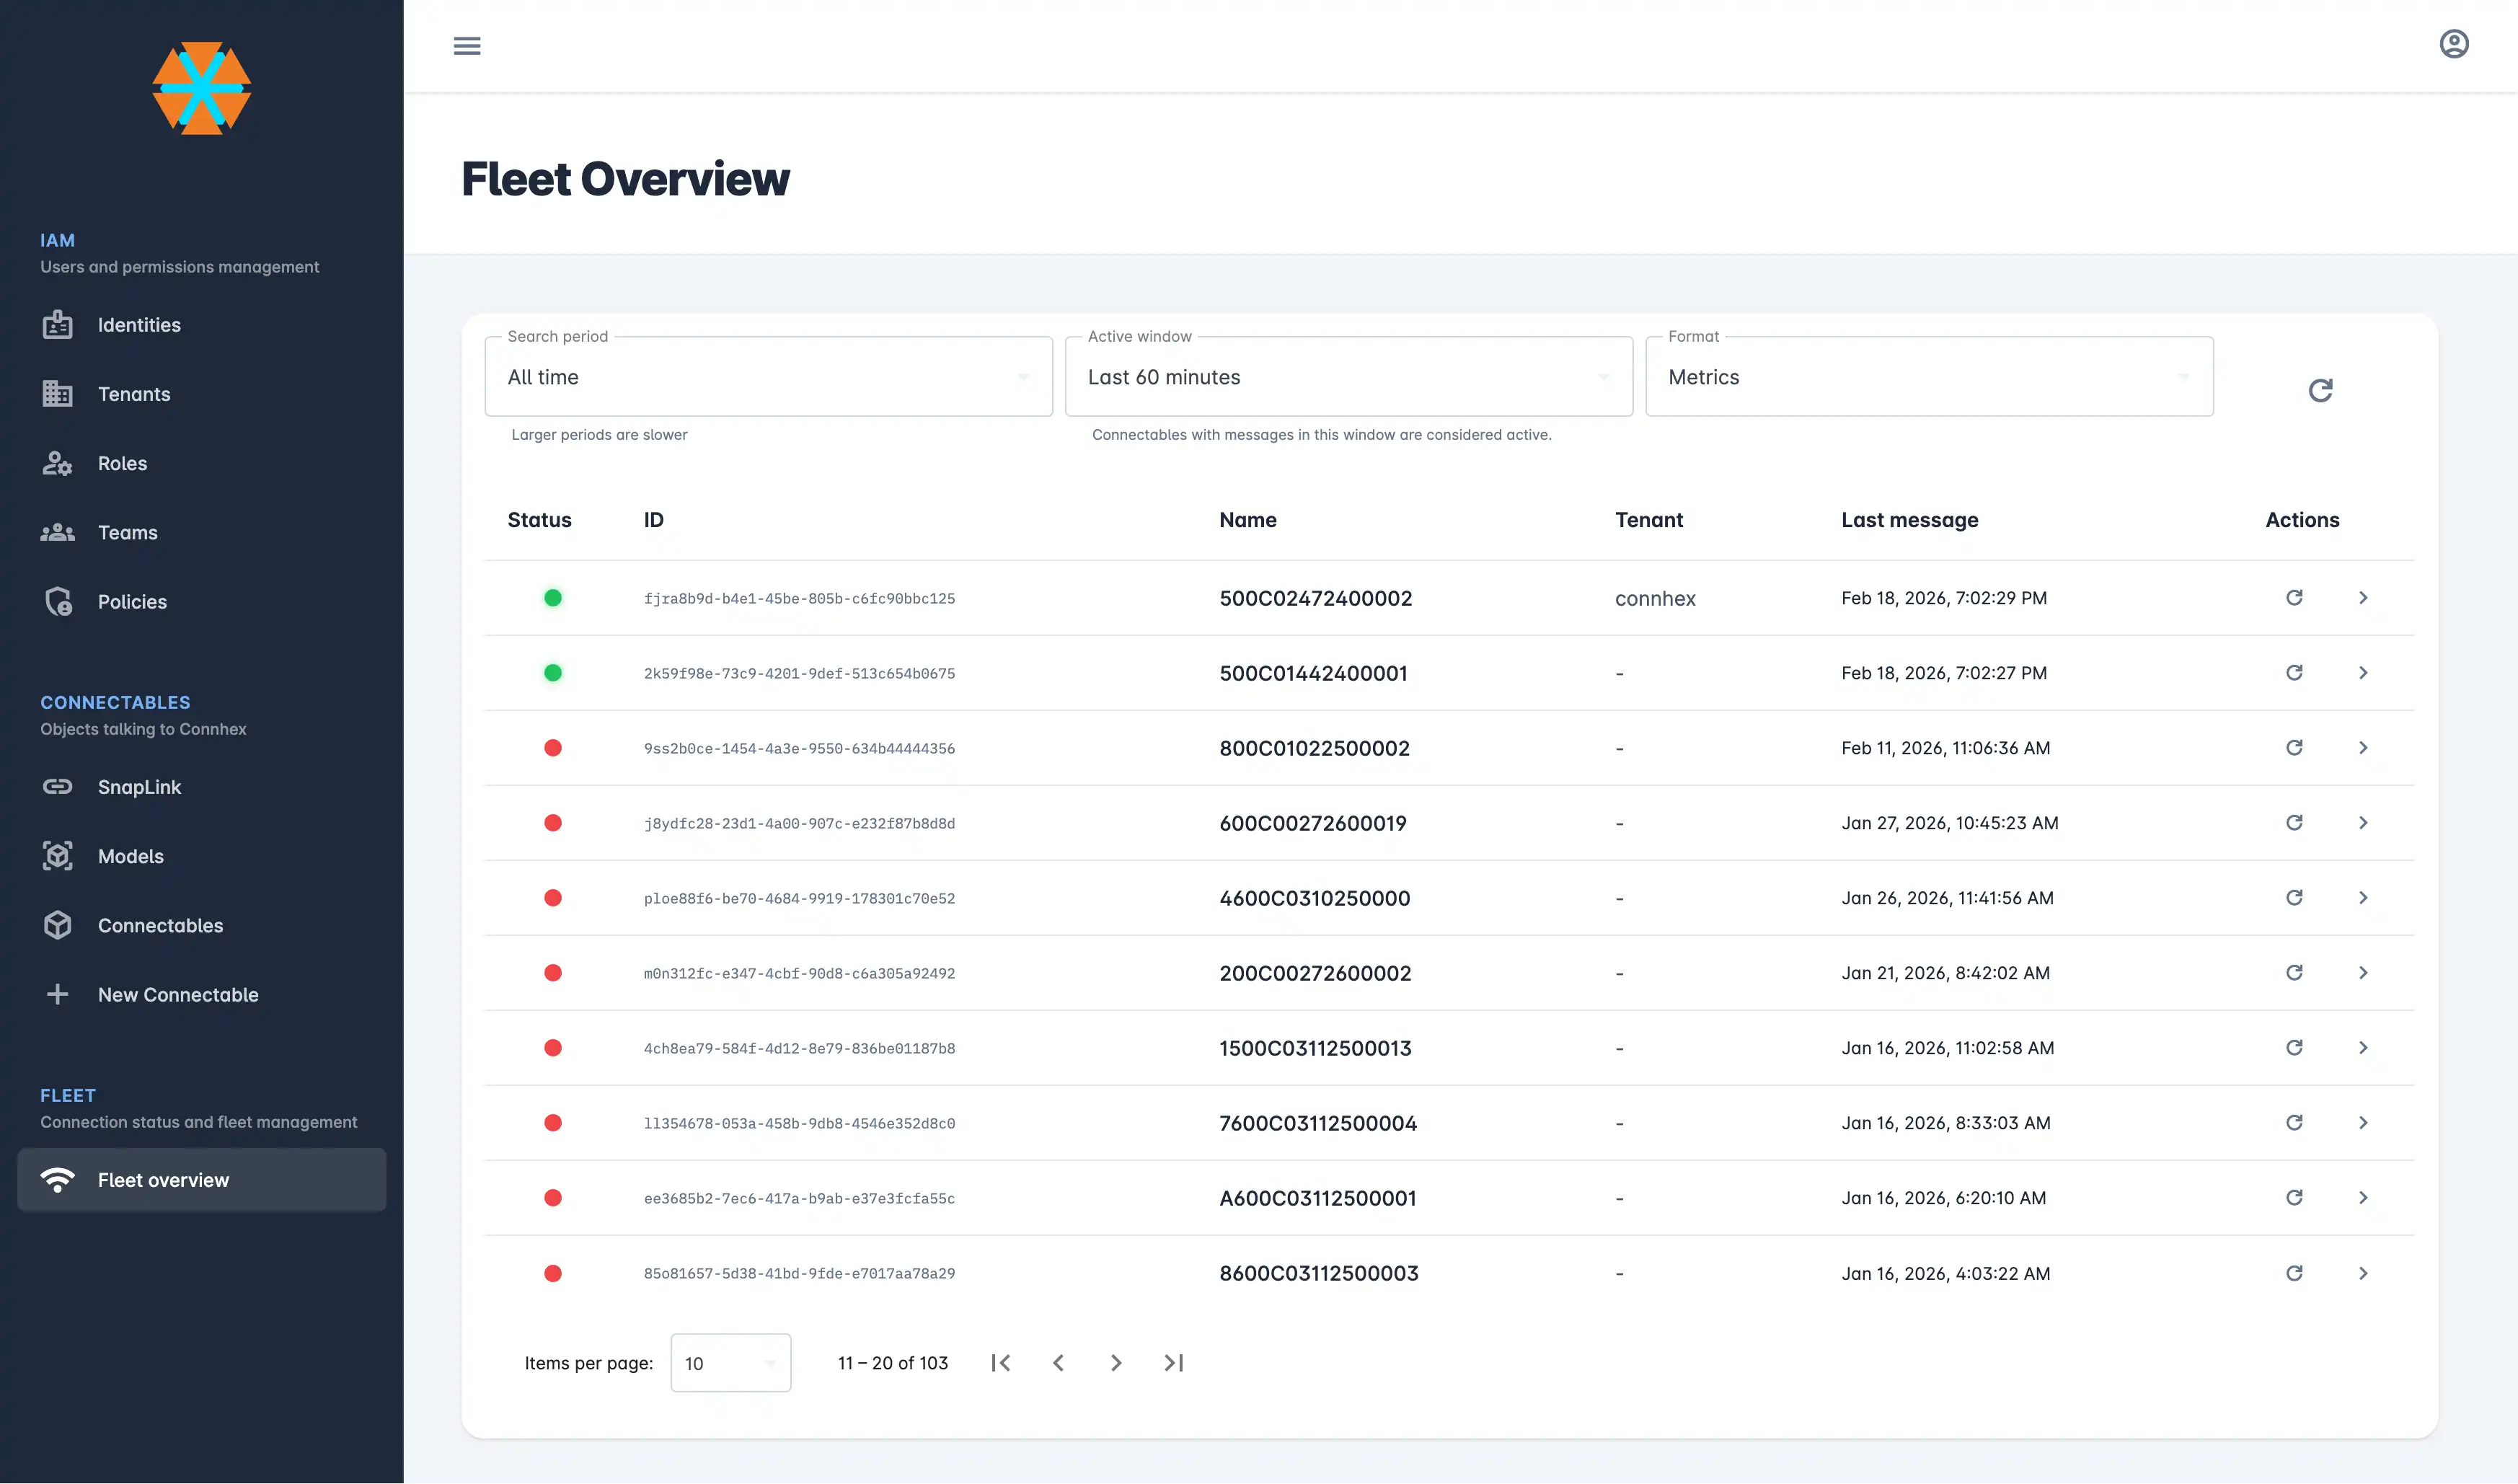
Device overview, directly in Connhex Control.
Once active, the system continuously collects data from every connected device. This allows the manufacturer's R&D team to observe how products behave under real operating conditions over time. Some concrete examples of what can be detected:
- a device whose RAM consumption grows steadily over time, indicating a possible firmware memory leak
- an operator panel that reaches abnormal CPU usage spikes during certain time windows or in response to specific usage patterns
- a PLC whose available disk space gradually shrinks due to improperly managed logs
Without a structured monitoring system, these situations only surface when the device stops working or becomes visibly slow. This typically happens months after installation, when intervention is more costly and the end user has already been affected.
Automatic Alerts
Using the Connhex rules engine, the manufacturer has configured automatic alerts on collected metrics. When a device crosses predefined thresholds - for example, RAM usage exceeding 85% for an extended period, or the processor's internal temperature surpassing a critical value - a notification is triggered. This enables proactive intervention before the problem reaches the end user.
Dashboards and Reports
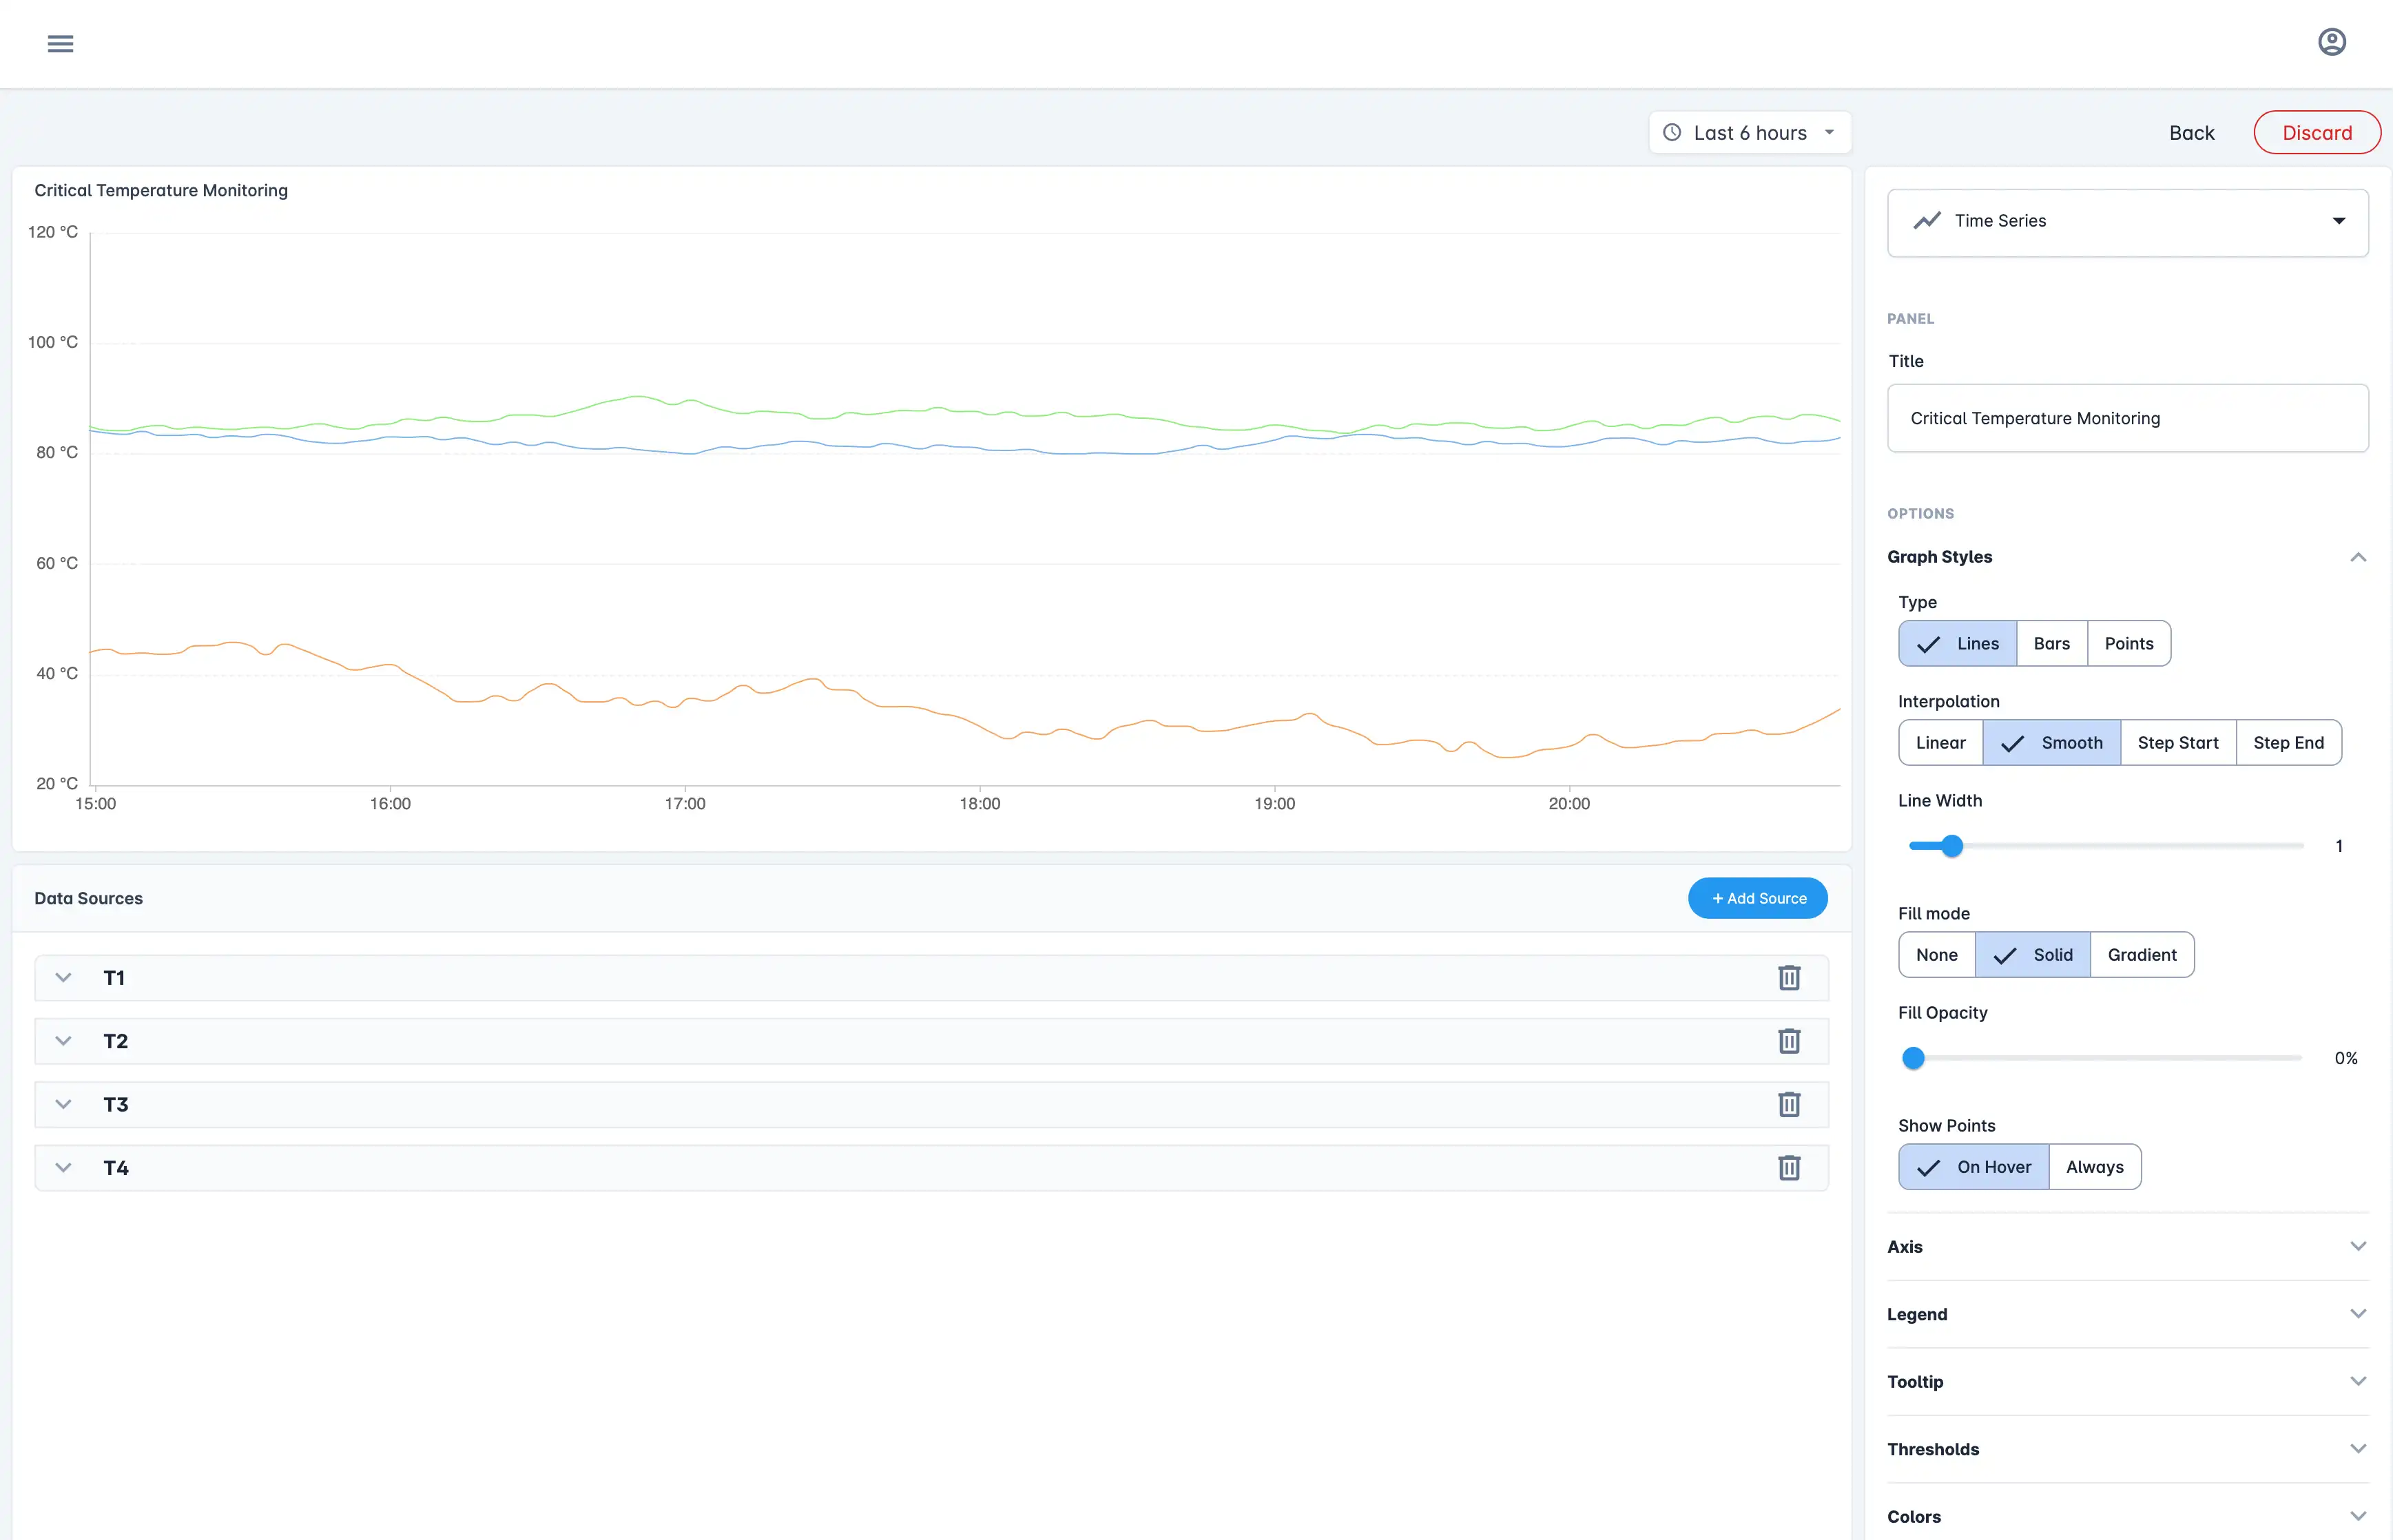
Customizable dashboards for every collected metric: dashboard edit view.
The collected data is accessible through customizable dashboards and can be exported for deeper analysis. The manufacturer's R&D team uses this information as direct input into the product development cycle.
Key Results
Adopting Connhex allowed the company to build a monitoring service without diverting resources from their core business: designing and manufacturing industrial hardware. The benefits span multiple levels:
Better future product versions. This is the most significant outcome. Real field data feeds directly into design decisions. For example, if the data shows that a particular product family consistently operates near its memory limits in certain applications, the team knows exactly where to focus in the next hardware revision or firmware optimization. Design choices are no longer based on estimates or qualitative feedback — they are driven by measurable evidence from thousands of active devices.
Value-added services, such as extended warranty programs. With continuous monitoring of device health, the manufacturer is in a position to offer extended warranty programs to its customers. Monitoring reduces risk by enabling the identification and resolution of issues before they result in failures, lowering the overall cost of support.
Faster diagnosis times. When a customer reports a problem, the support team already has access to the full metric history of the device. This dramatically reduces the time needed to identify the root cause and plan the appropriate intervention.
No infrastructure investment. The manufacturer did not need to build, manage, or maintain a proprietary cloud infrastructure. Connhex provides the entire stack — from data collection on the device to cloud visualization and alerts — as a ready-to-use service.
Why Connhex for Product Monitoring
For an electronics manufacturer that wants to monitor the performance of its products in the field, there are essentially two paths: build a proprietary system, or use an existing infrastructure.
Building a proprietary system means taking on the complexity of developing a software agent for the device, a backend for data collection and storage, a visualization interface, an alert system, security and certificate management, and OTA updates. This is a full-scale software project, with costs and timelines that are often incompatible with the priorities of a company whose focus is hardware.
Connhex offers all of this in a single, already validated suite. System Monitor is a native component of Connhex Edge, optimized for embedded Linux devices. It requires no custom development, integrates with Connhex Cloud without complex configuration, and automatically receives updates and new features as they are released. For anyone who needs to monitor their products — rather than build an IoT platform from scratch — it is the most direct path forward.
What's Next
We are working with the company to extend monitoring to all product families in their catalog, and to make the monitoring dashboards accessible to their end customers as well — turning the service into a differentiating element of their commercial offering.
The Connhex integration ensures that every new feature added to the suite is automatically available, with no additional effort required. This means the monitoring system evolves together with Connhex, without requiring incremental investment from the manufacturer.